Compatible with: Amazon
Insights Dashboard for Amazon Sellers
Customizable smart dashboard for e-commerce sellers & brands
Benefits of Insights Dashboard
Accelerate decision-making and increase efficiency
- Save time and money with actionable daily business Insights
- Analyze and outperform your competition with Automated Competitor Tracking
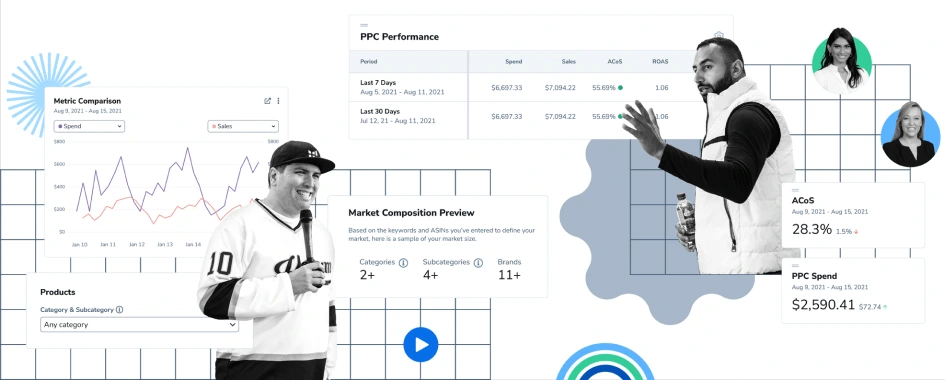
- Quickly and accurately evaluate business performance at a glance
- Unlock the power of data to easily identify new growth opportunities
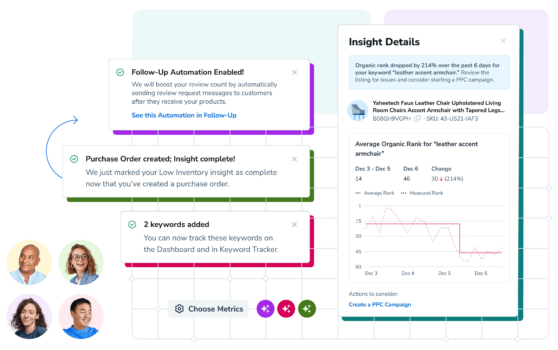
- Consolidate scattered data
- Identify growth opportunities
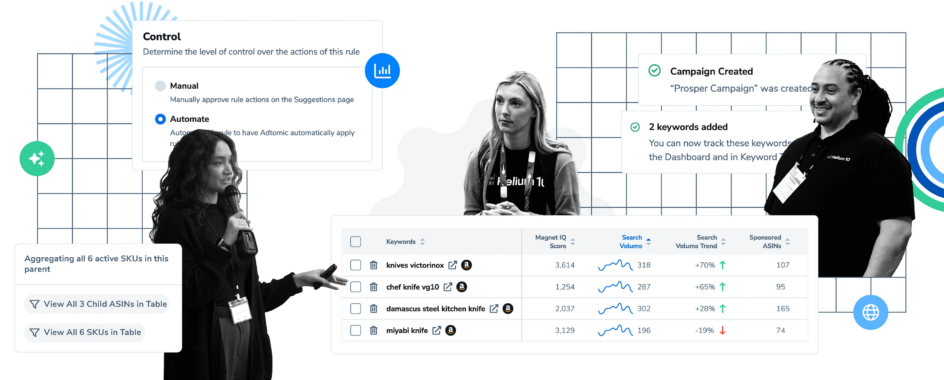
- Automate competitor tracking
FAQs
Quick actions that can deliver big results!
Learn how Insights Dashboard can save you time and money while reducing your manual workload.
Additional Benefits of Helium 10
Solutions for Every Seller
Meet Our In-House Experts
Learn from industry leaders through webinars, courses, podcasts and more
TikTok Features now in Diamond
Plans & Pricing
Effortlessly expand your Amazon operations to TikTok Shop with our new suite of TikTok-specific features now included in Diamond!
Save up to 25%
per month when billed annually
Diamond
Billed Annually
looking to scale – on
Amazon and beyond
Platinum
Billed Annually
business— now with
AI Advertising!

9,606
People signed up last week.
Start Using Helium 10’s Insights Dashboard Today!
If you’d like to try out Insights Dashboard for yourself, sign up for a free trial to check it out online today!
Sign UpThe Details
How to Use Insights Dashboard
Insights Dashboard displays the key metrics for e-commerce business owners, and helps provide sellers with insights, recommendations, and actions alongside critical business KPI widgets and business forecasting visualizations. The dashboard aims to help sellers save valuable time by minimizing the need to dig into complex sets of data, allowing sellers to focus on prioritizing the most impactful actions for their business.
To get started using Helium 10’s Amazon Seller Dashboard, first head to the Grow Your Business section. This area provides sellers with quick, actionable suggestions customized to your listings that are designed to help grow your business. For each suggestion, you will see the potential impact level as well as a the ability to ‘Take Action’. In the center of the dashboard there is a graphs section, which provides visual displays of your Revenue, Top Products, and Advertising data at a glance. The Top Products tab shows a graph of your top products’ data for revenue, units sold, or refunds, and the Advertising tab shows your key advertising metrics, including Gross Revenue, PPC Spend, ACoS, and TACoS.
The Insights provided by the Dashboard are incredibly valuable for Amazon sellers. They can inform important business decisions and help improve sales performance. The Dashboard automates the analysis of data on customer behavior, sales patterns, and market trends, which therefore helps sellers gain a deeper understanding of their target audience, as well as easily identify opportunities for growth.
